Based Logs #7 - RenderDoc
May 20, 2024
Debugging graphics isn’t straight forward so getting used to tools like RenderDoc seems essential. At this point I haven’t ever had to debug because I’m the greatest graphics programmer alive. Well, the real reason is there isn’t too much happening in my shader files. The most I ever wanted to debug at this point was to view some of the data I was passing to my uniforms.

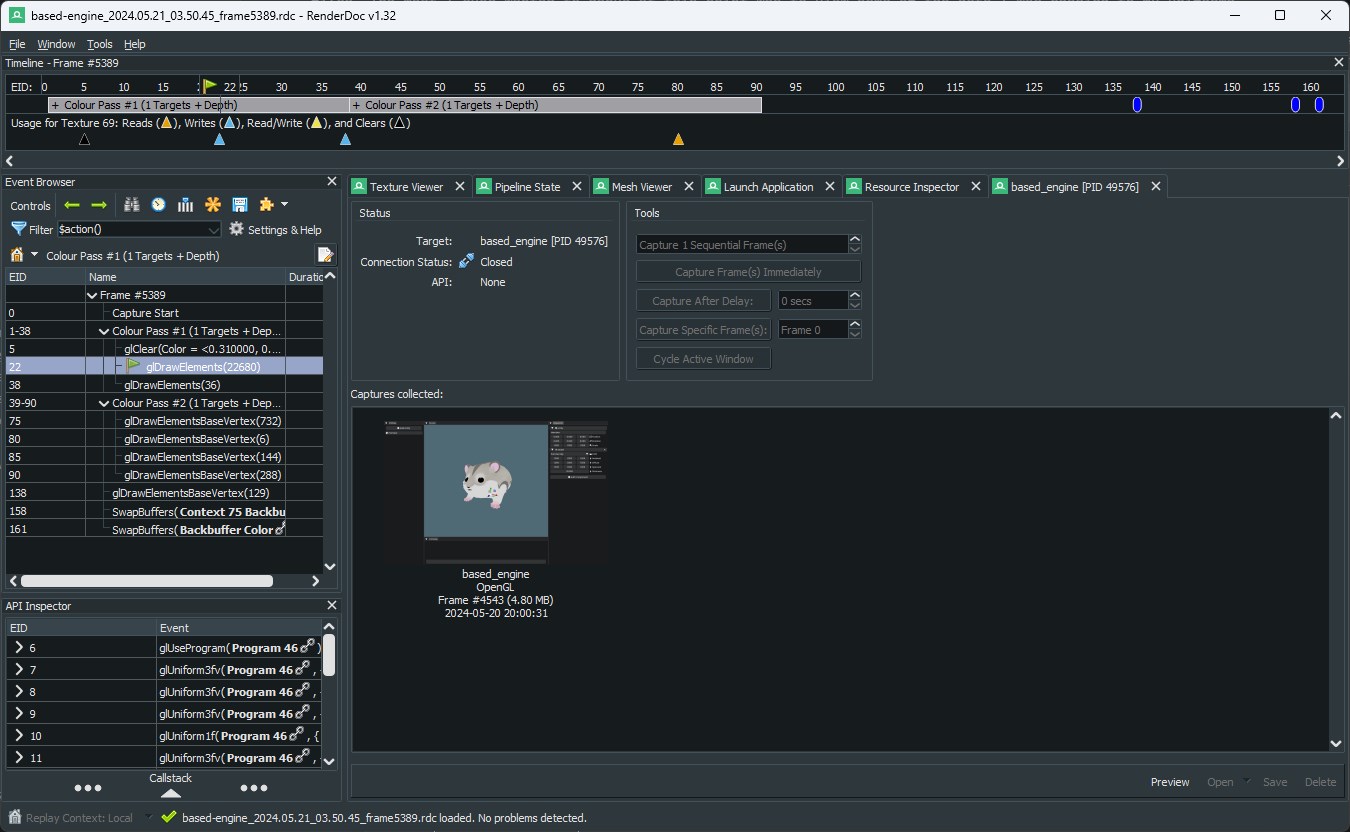
My first impression is that the UI looks like it was designed in the 1990s… although usually that indicates the program is engineered well 😅. Anyways, you point it to your .exe file, launch the .exe via RenderDoc and then capture a frame within your application. In this case I just captured a simple scene where I render a single hamster model with an orange cube behind it.
The timeline at the top allows you to scroll through each event. What’s interesting is you can see how the elements of the application get built.
- It clears the entire screen via
glClear - Draws the hamster model
- Draws the orange cube
- Draws the ImGui borders
- Renders the scene texture onto the ImGui panel
- Then finishes rendering the actual UI elements inside of the ImGui panels
On the left side you can view the frame timings to see how long each event took to process. If you compare my hamster to the cube it takes about ~5x longer to draw the hamster (duration isn’t visible in the screenshot above but you can see it by clicking the timer icon).
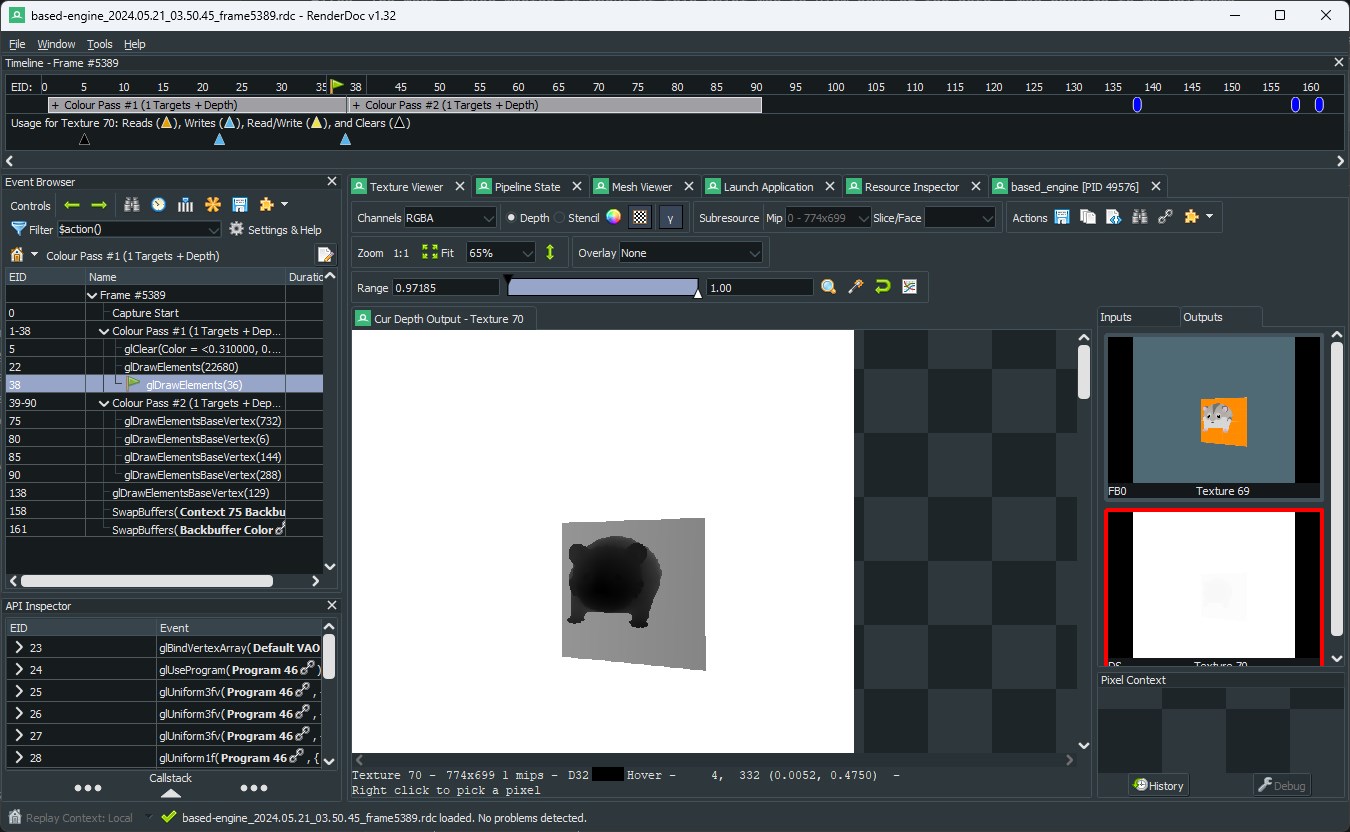
I’m going to move my timeline to the first event where the cube is drawn. Then check out some of the information each tab has to offer.

There is quite a lot of information available regarding the texture here. The most interesting parts that jump out at me is the ability to view the depth and stencil texture. Especially since you can use the slider to filter out depth values. If you read my last blog, you know that the highest depth value of 1.0 means the object should have the least priority and drawn in the back. Decreasing the slider ranges does exactly that and begins to filter the cube behind the hamster before filtering out the hamster itself.

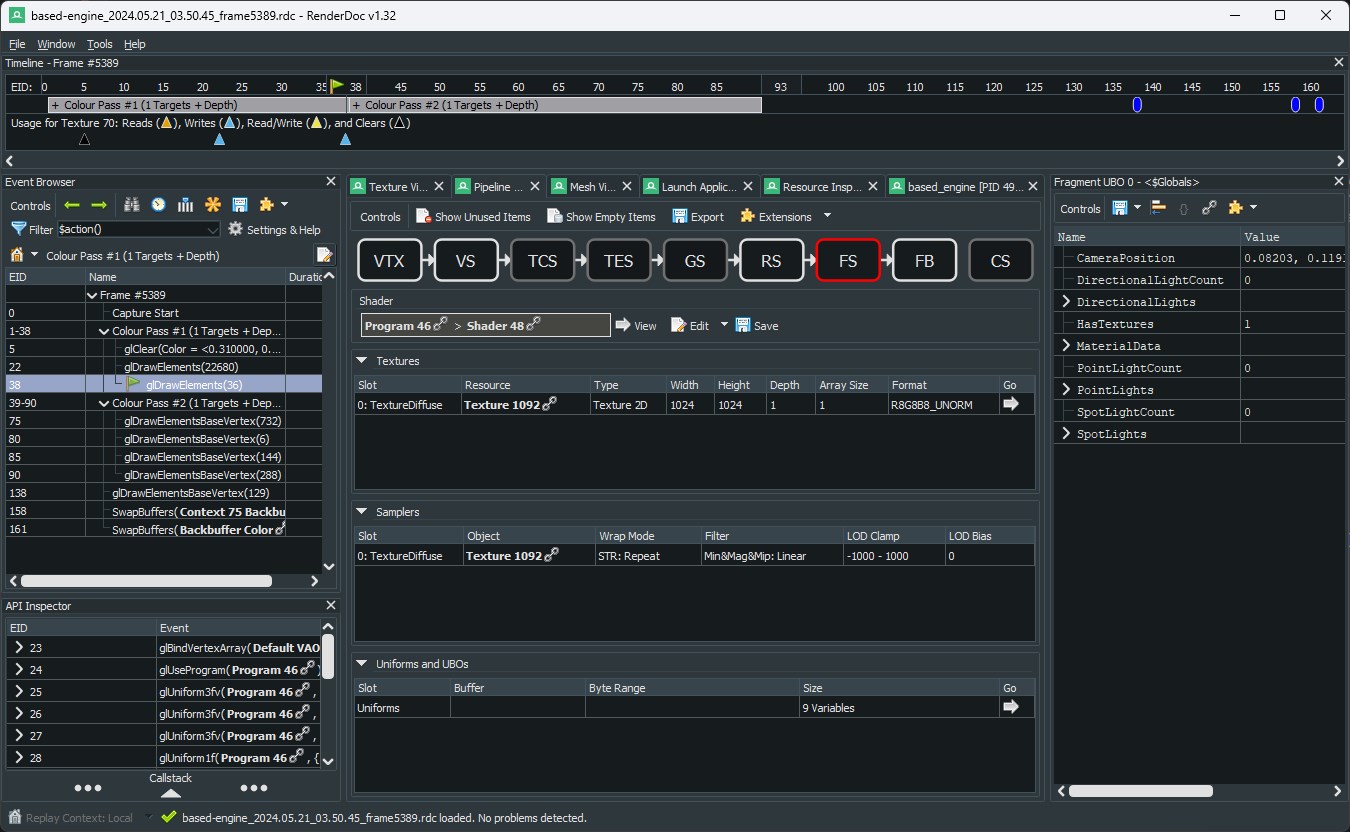
The pipeline state gives you a view into the graphics pipeline. The vertex shader and fragment shader stages are the two I’m most familiar with since most of the work happens there. You have access to the texture data that is being passed as well as the values that are being set on any uniform for each of the shaders.
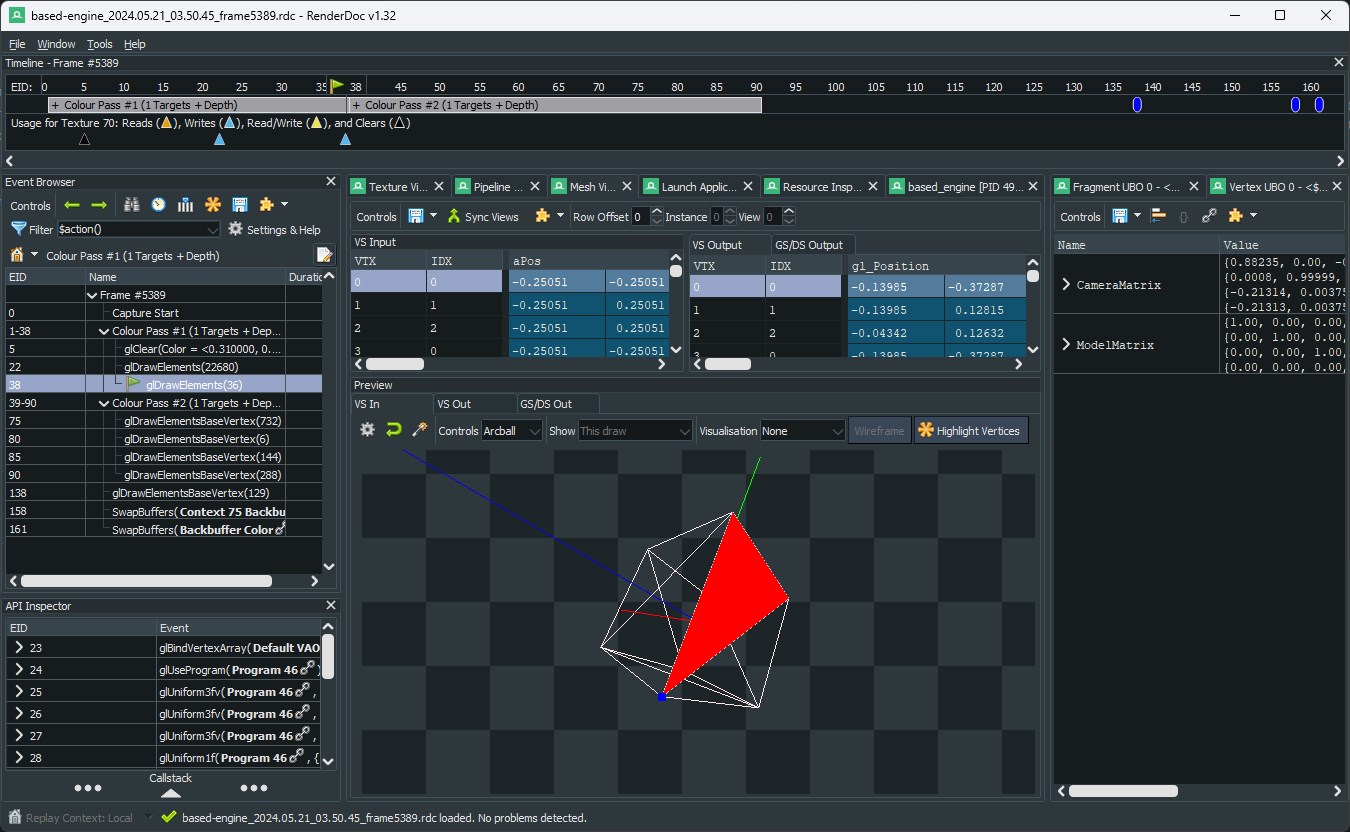
VTX or the vertex input stage is extremely impressive as you can view all of the data being passed as well as a 3D view of the vertex data itself. This takes us to the next tab “Mesh Viewer”.

You can see above a wireframe view of the cube that was drawn on the current event id. You can even individually click on each vertex that was sent and it highlights it in the 3D view.
The application seems pretty easy to use and I imagine it’ll become quite useful as I dive into more complicated graphics features. The other big application people use is NVIDIA Nsight… but I no longer work there so my heart is broken so I won’t be looking at it for now.